

Months of Inventory Grows

The term “Months of Inventory” is a calculation that quantifies the relationship between supply and demand in a housing market. Simply put it shows the balance of power between buyers and sellers, telling us less about the number of properties for sale (active listings) and more about the rate at which homes are selling.
When MOI is below 2, that means we have a very high demand for homes and a strong seller’s market.
When MOI is between 4-6, we have a balanced market. However, I’d suggest that anything above 3 feels more like a buyer’s market.
So how are various price points looking when it comes to MOI across the Denver metro area? Take a look at this latest chart.
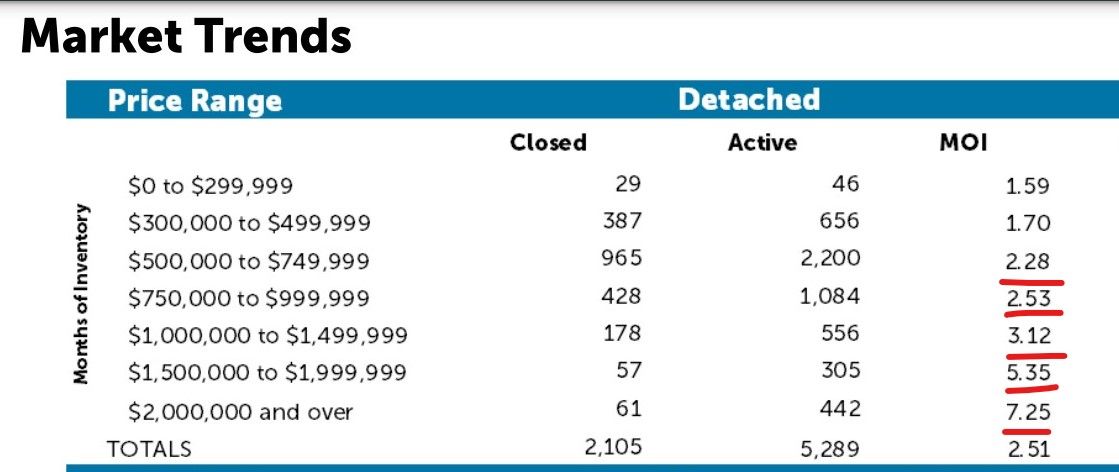
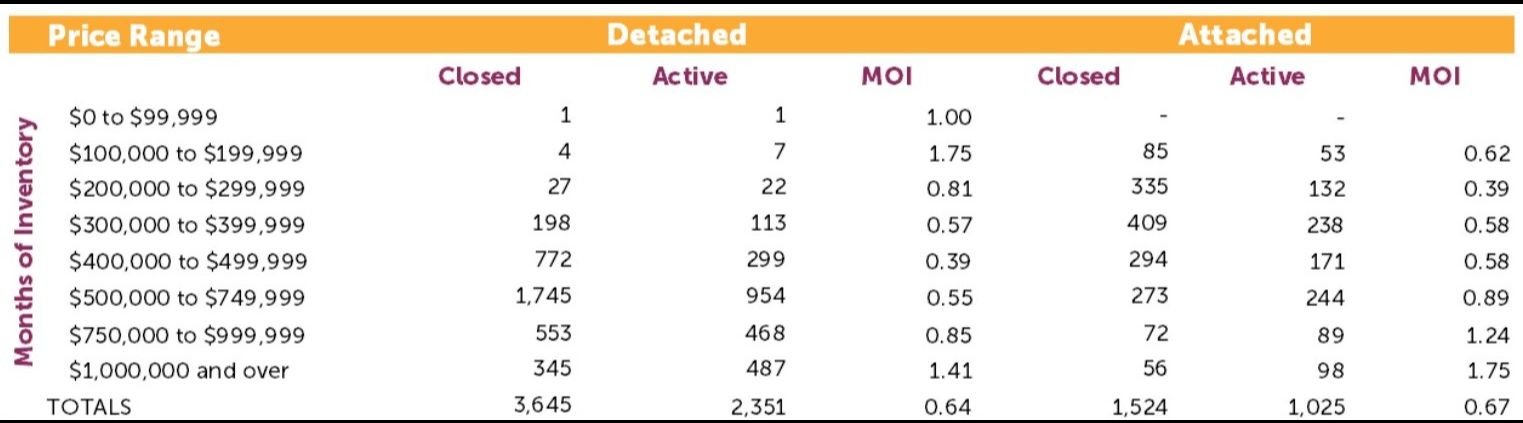
Now look at how much MOI has changed since this same time 2 years ago in the chart below. These stats are from Nov 2021.
When MOI is below 2, that means we have a very high demand for homes and a strong seller’s market.
When MOI is between 4-6, we have a balanced market. However, I’d suggest that anything above 3 feels more like a buyer’s market.
So how are various price points looking when it comes to MOI across the Denver metro area? Take a look at this latest chart.
Now look at how much MOI has changed since this same time 2 years ago in the chart below. These stats are from Nov 2021.
This drastic change in MOI from 2021 to 2023 of course has been brought on by the climb in interest rates, a drop in buyer demand, and home inventory that lingers longer than it has in years.
Have we seen prices drop as a result of the higher MOI? Yes and no. The market stats show that the average price is still staying pretty steady. But I’d also say that based on what I’m seeing in the market, prices have definitely softened. Will a seller sell at a price at or above their neighbors that sold earlier this year or last year? Id say probably not in most cases.
Have questions about your specific neighborhood in the Denver metro area? Let me know! I’d be happy to discuss this with you!
Recent Posts

The 5-Year Rule for Home Prices

The Advice First-Time Homebuyers Need To Hear

The Truth About Where Home Prices Are Heading

Selling and Buying at the Same Time? Here’s What You Need To Know

Should You Buy a Vacation Home?

What You Should Know About Getting a Mortgage Today

Think No One’s Buying Homes Right Now? Think Again.

Why Big Investors Aren’t a Challenge for Today’s Homebuyer

Top 5 Reasons To Hire a Real Estate Agent When You Sell

Multi-Generational Homebuying Hit a Record High – Here’s Why
We're here to serve in a way that creates the best real estate experience for you from the mountains of Colorado to the Florida Gulf Coast.