

Home Buyer Showing Activity in Denver

How’s Home Buyer Showing Activity?
The 30 year conventional mortgage rate approached 7.48% yesterday according to Mortgage News Daily. The 30 year VA mortgage rate was at 7.11%. It’s been a steady uphill climb for rates this summer. It’s no surprise that affordability has taken a big hit locally as a result of this climb in rates. With that, home buyer demand has definitely declined across the Denver metro area. How much?
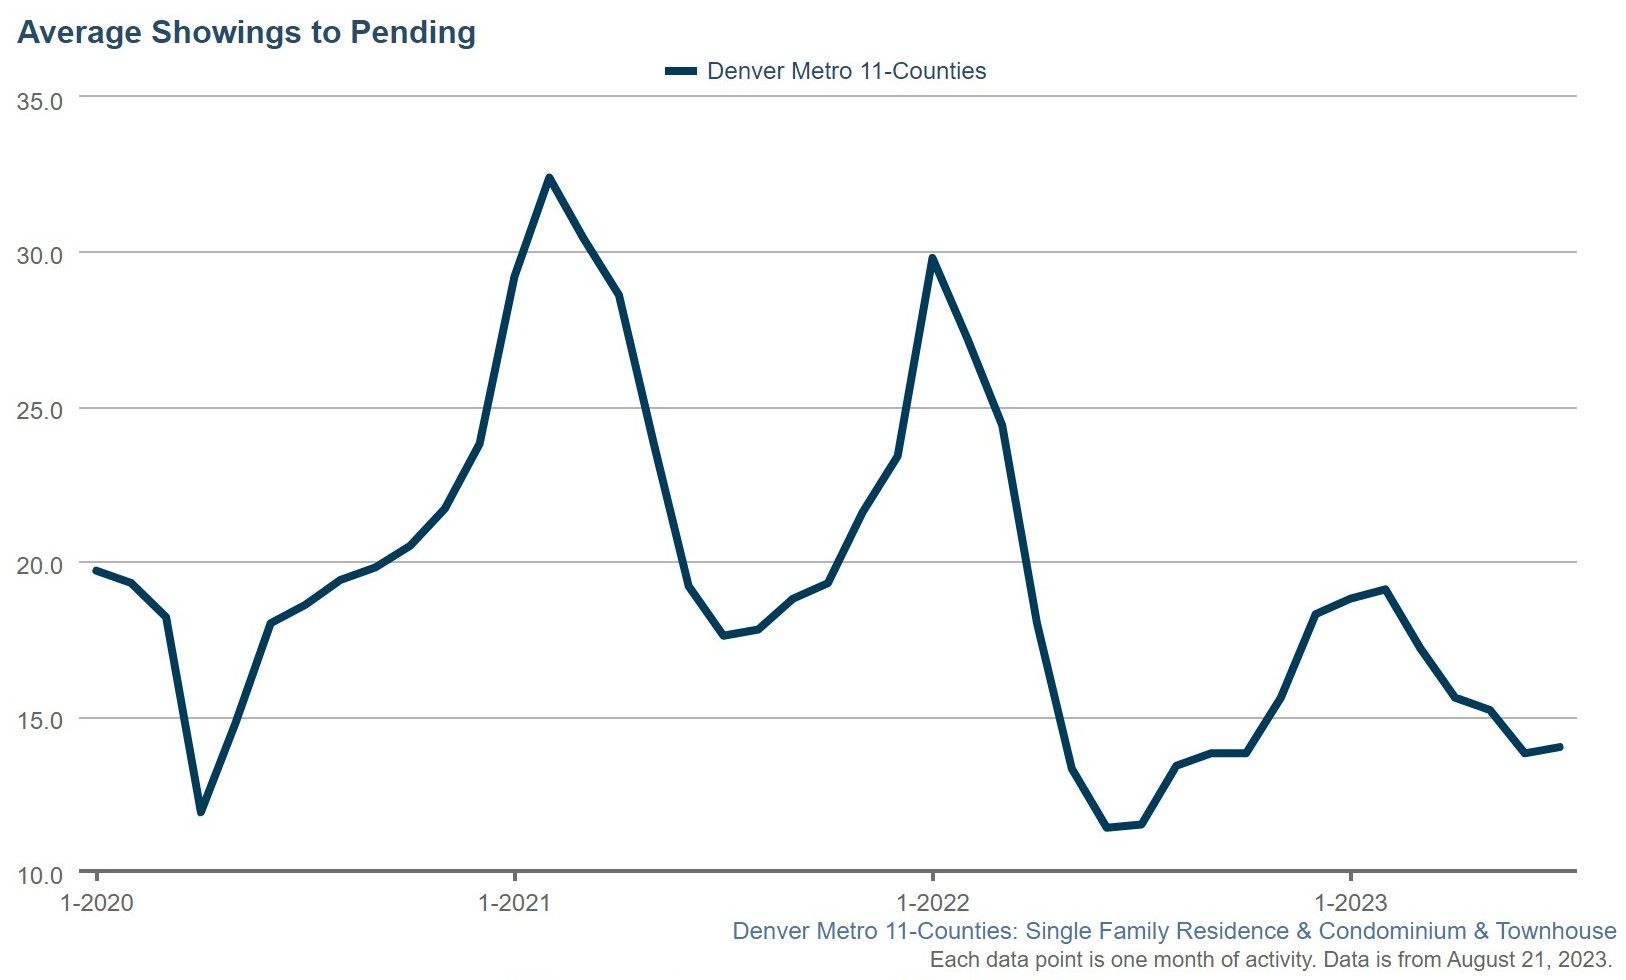
The graph above shows us how many showings on average a home has received before going “pending”. At the peak of demand in 2021, we saw nearly 33 showings per listing that went under contract or pending in the Denver metro area. In 2022, it peaked at 30 showings per listing. Most recently, we dipped well below that to about 14 showings per listing.
The graph below shows us the showing activity for homes that were still active at a particular month’s end. Again we saw those numbers peak in 2021 and 2022, with showings above 20 for those active listings at month’s end. Last month, the average number of showings dipped to 6.6 for those homes still on the market at month's end.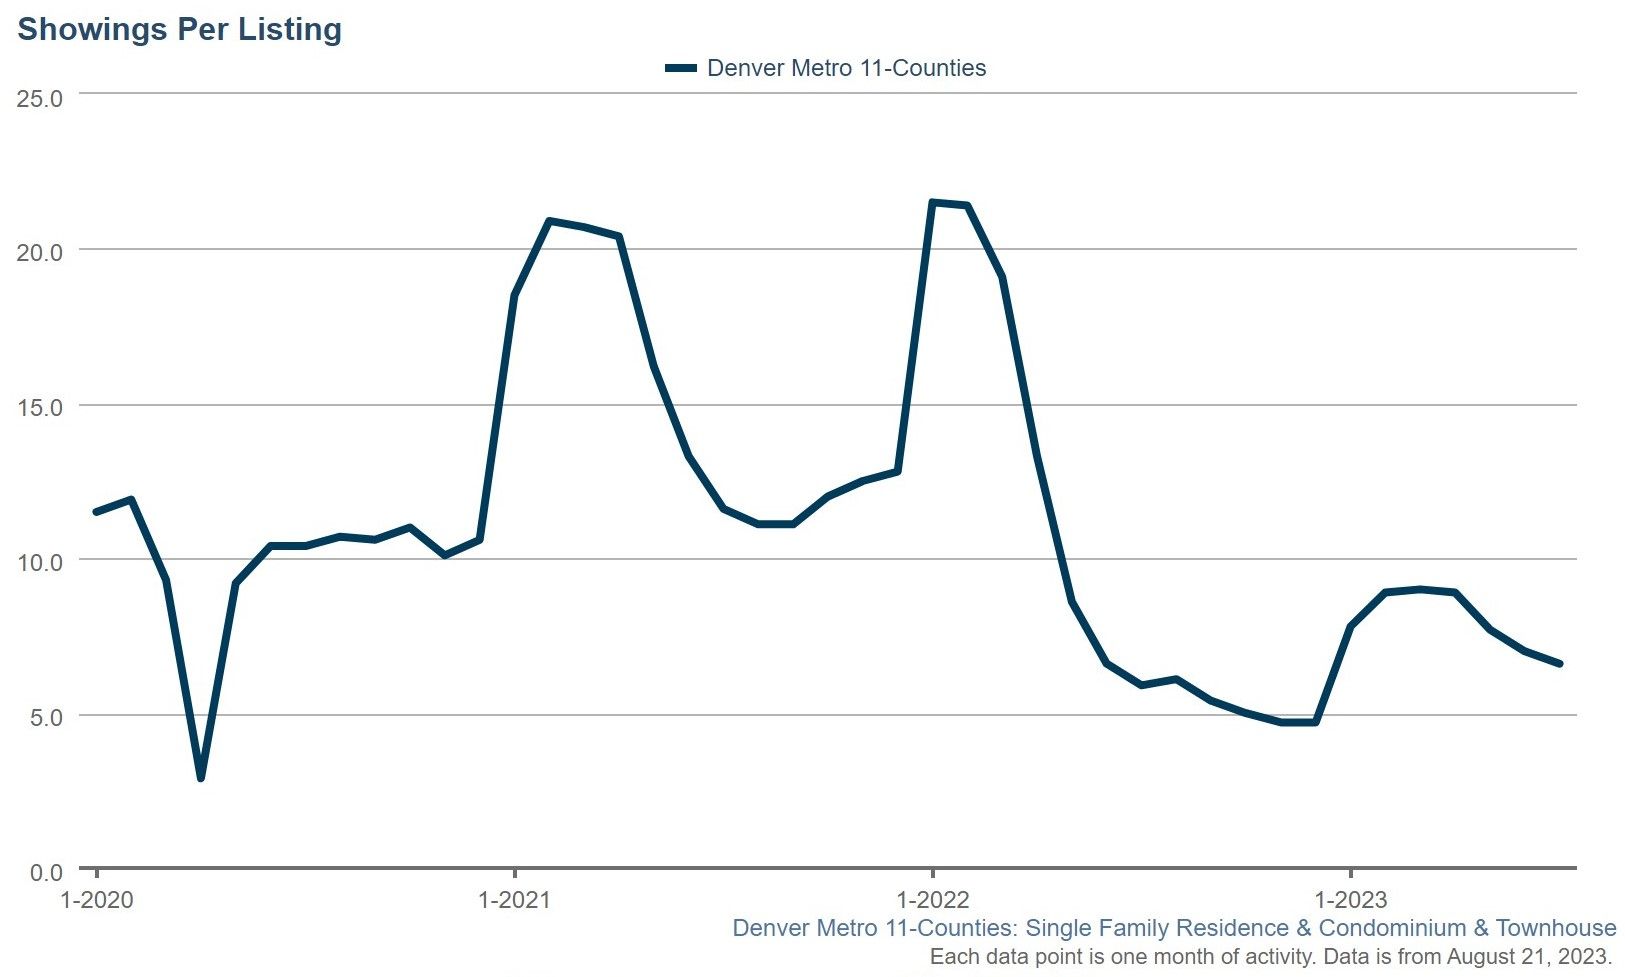
What does this tell me? For one, home buyers are still out there, although in smaller numbers overall (which is why prices haven’t plummeted). Also, the homes that are well positioned (price, condition, exposure) are still getting decent traffic and securing offers. Those that aren’t well positioned are lingering and buyers are passing them by.
Want to talk about a particular area or neighborhood’s current demand or your probability of selling? Let me know! I’d be happy to connect.
Drew Morris
Recent Posts


We're here to serve in a way that creates the best real estate experience for you from the mountains of Colorado to the Florida Gulf Coast.